


Financial review
Overall, we are very satisfied with this set of results, in particular
|
 DORETTE NEETHLING Chief Financial Officer |
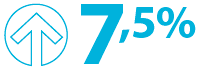
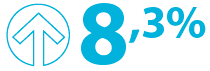


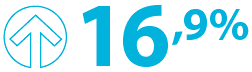 Operating expenses of R1.424 billion are 5% higher than the prior year (R1.356 billion), mainly driven by higher selling and distribution tracking higher sales and inflationary impacts on fixed and administrative expenses. Trading profit of R605.7 million is R87.7 million (16.9%) ahead of the comparative year’s profit of R518.0 million. |
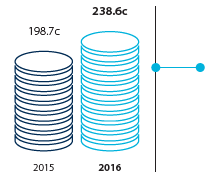 |
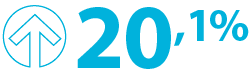
HEPS adjusted (continuing operations) Headline earnings for the year amounted to R376 million compared to R335 million in 2015. This translates into headline earnings per share of 226.1 cents in 2016 (2015: 198.7 cents). Excluding the once-off IFRS 2 charge mentioned earlier, headline earnings per share from continuing operations would be 238.6 cents, an improvement of 20.1%. |
|
TRADING PROFIT (R’000) |
|||
 |
|||
Non-trading expenses of R52.4 million recorded in the current year include sharebased payments of R39.9 million of which R20.8 million relates to a once-off charge resulting from the modification of the B-BBEE scheme in July 2015. It also includes listing and other incorporating fees related to the new BEE vehicle (AdBEE) (R3.4 million) as well as advisory costs for exploratory M&A activity (R0.5 million). Transaction costs related to the disposal of Cosme (India) and Ayrton (Ghana) are included in the amount reflected under discontinued operations.
Operating profit ended on R553.2 million, 10.9% or R54.2 million up.
The net finance costs for the year are R71.8 million compared to R83.6 million recorded last year.
Income from investments, being dividend income from the Tiger Brands Black Managers Trust is R9.2 million, compared to the R10.7 million in the previous year.
Equity accounted earnings for the year from National Renal Care (JV with Netcare) and the plant in India are R59.3 million (2015: R65.6 million), weighted approximately 56% towards the Indian operation.
Profit before tax for the year is R549.9 million, 11.8% ahead of the previous year.
The high effective tax rate is a consequence of certain expenditure being non-deductible for tax purposes and a number of audits of prior years being finalised with SARS.
The profit after tax for the year for continuing operations is R379 million, compared to a profit of R350 million in 2015, an improvement of 8.4%.
The reported loss after tax from the discontinued operations of R200 million includes:
| • | impairments of R135 million on India’s intangibles and R73 million on Ghana’s assets now held-for-sale, as well as |
| • | transaction costs of R20.1 million for India and R2.5 million for Ghana. |
The prior year loss of R151.1 million includes impairments of India’s intangibles of R74.4 million and Ghana’s plant and equipment of R7.4 million.
Minorities in Novartis Ophthalmics, Menarini and Ayrton account for just over R10 million. The higher value compared with the prior year is due to significantly better performances in those businesses.
OVER THE COUNTER (OTC)
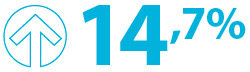
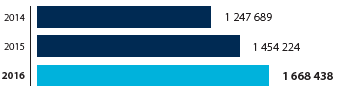
Turnover of R1.7 billion is R214 million (14.7%) higher than last year, achieved through an average price increase of 7% with the balance relating to volume and mix. The Top 4 brands in the Division, each of which generate annual revenue in excess of R100 million are showing double digit growth.
Gross margin deteriorated due to the exchange rate impact of the weaker rand, coupled with a change in mix as consumers continue to down trade from higher margin products to lower margin products and smaller pack sizes.
Operating expenses, ended 6.1% ahead of the prior year, mainly as a result of higher selling and distribution expenditure related to the higher sales and the filling of sales vacancies that existed in the prior year.
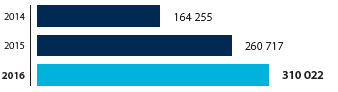
This translated into trading profit of R310 million increasing by almost R50 million from 2015.
 |
 |
|
TURNOVER (R’000) |
TRADING PROFIT (R’000) |
|
 |
 |
PRESCRIPTION
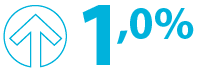
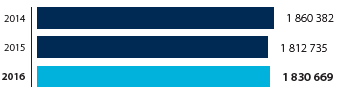
This division’s turnover of R1.8 billion is R18 million (1%) higher than the previous year. The benefit of the SEP increase was offset by the repatriation of some of the multinational brands and the slight reduction in Generic sales. ARV sales into the private sector have significantly outperformed the prior year and this mitigated the volume and mix decreases.
The gross margin percentage is tracking ahead of the prior year, the impact of the weaker currency, being offset by lower stock impairments and better efficiencies in the Wadeville factory through increased ARV volumes.
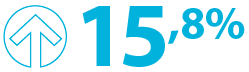
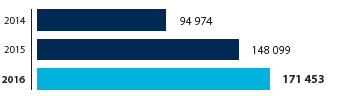
Operating expenses are in line with last year resulting in trading profit of R171 million, well ahead of the comparative figure of R148 million.
 |
 |
|
TURNOVER (R’000) |
TRADING PROFIT (R’000) |
|
 |
 |
CONSUMER
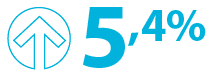
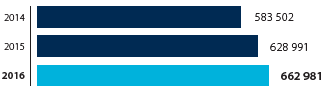
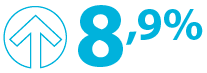
Turnover of R663 million is 5.4% ahead of the R629 million reported in 2015. This business realised 4% through price and 4% in volume, which was offset by some discontinued lines. Panado, our leading brand, posted growth of 7%.
Gross margin improved from 2015, due to lower inventory impairments and an improved sales mix compared to 2015.
The increase in operating expenditure of R30.1 million (12.2%) has arisen as expenditure consequent to the higher sales as well as increased regulatory expenditure relating to the anticipated CAMs regulations.
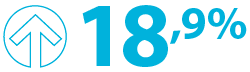
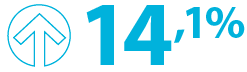
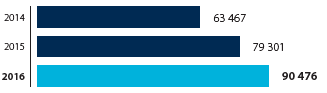
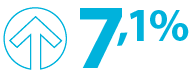
This resulted in trading profit of R90 million being R11 million (14.1%) higher than 2015.
 |
 |
|
TURNOVER (R’000) |
TRADING PROFIT (R’000) |
|
 |
 |
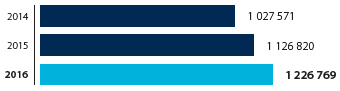
HOSPITAL
Turnover of R1.2 billion increased by 9% over the prior year with price and volume each contributing 4% and mix 1%. Medicine delivery as the main driver of the volume improvement was due to strong growth in the Large Volume Parenterals portfolio including a significant increase in sales of pour bottles. There was also an increase in focus and activity in the Renal business resulting in solid demand for treatment and therapies across the range, but with increased pricing pressure.
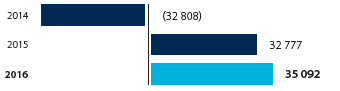
Gross margin was impacted by the weaker rand and with operating expenses up only R8 million (3%) from last year, resulted in trading profit of R35 million, and improvement of 7% over 2015.
 |
 |
|
TURNOVER (R’000) |
TRADING PROFIT (R’000) |
|
 |
 |
REST OF AFRICA
Rest of Africa turnover (excluding Ghana)
of R179 million increased by 21% over the
prior year. Despite this top line growth,
these businesses continue to disappoint at
the trading profit line and made a loss of
R3.5 million in the current year compared to a
loss of R4.3 million recorded in the prior year.
DISCONTINUED OPERATIONS
Ghana and India
The Indian operation has been treated
as held-for-sale and is reflected as a
discontinued operation from 1 July 2015.
In line with this accounting treatment,
amortisation and depreciation of the Indian
assets were suspended from the start of the
current financial year. For a more meaningful
comparison of the discontinued operation
in the income statement, depreciation and
amortisation in the current year would have
amounted to R45 million.
The Ghanaian operation has been treated as held-for-sale and reflected as a discontinued operation from 30 June 2016.
BALANCE SHEET
The Group has Shareholders’ funds of R3.229 billion at June 2016.
The non-distributable reserves have increased by R123.5 million from the previous year. This increase has resulted mainly from movements in the foreign currency translation reserve of R118.3 million of which R86.8 million relates to the discontinued operations in India and Ghana.
Non-current assets
Intangible assets, including goodwill,
have a carrying value of R276.1 million.
The portion of intangible assets relating
to the Cosme trademarks of the India
business are now included in held-for-sale
assets at R381.1 million. An impairment of
R135.2 million was recorded against these
intangible assets in the current year.
Other financial assets of R74.3 million are primarily the capital contribution made to the Tiger Brands Black Managers Trust which has reduced as options were exercised in the current year.
Current Assets
Inventory of R1.167 billion is lower than the
June 2015 carrying value of R1.208 billion.
Days in inventory are 119, an improvement
on the 129 days reported in December 2015.
The amount of inventory write offs has improved in the current year but the focus on this will continue to further drive down these impairments.
Trade accounts receivables of R1.320 billion reflect the increased trading activity and sales pattern. The book remains well-controlled and 89% of receivables are within 60 days due. There were no material bad debt write-offs or recoveries in the period. Government debt accounts for 12% of the total debtors’ book, in line with the prior year.
Borrowings
Long term borrowings of R500 million comprise
entirely of the Nedbank term loan, bearing
interest at the 3-month JIBAR rate (currently at
7.3%) + 176 basis points, payable quarterly in
arrears, with the capital due for repayment in
December 2018.
The debt:equity ratio (excluding assets heldfor- sale) at June 2016 is 9.6%, with net debt of R311 million. The Group is comfortably able to service its obligations with headroom in the facilities of more than R1.5 billion.
CASH FLOWS
Cash generated from operations was R941.1 million (2015: R598.1 million), supported by a decrease in working capital of R113.8 million (June 2015: increase of R126.4 million). This important indicator starts to convey the positive outcomes of the Group restructure and the advantages of restored management control. The cash flow improvement has enabled the Group to reduce net debt in continuing operations from R777 million to R311 million at the end of the financial year.
DIVIDEND DISTRIBUTION
A final dividend of 54 cents per share was declared for the year ended 30 June 2016 out of income reserves. Total dividend distributions for the year was therefore 104 cents per share an increase of 28% compared to 2015. This distribution is in line with the Company’s policy of covering dividends 2 - 3 times by headline earnings.