



 37 / 182

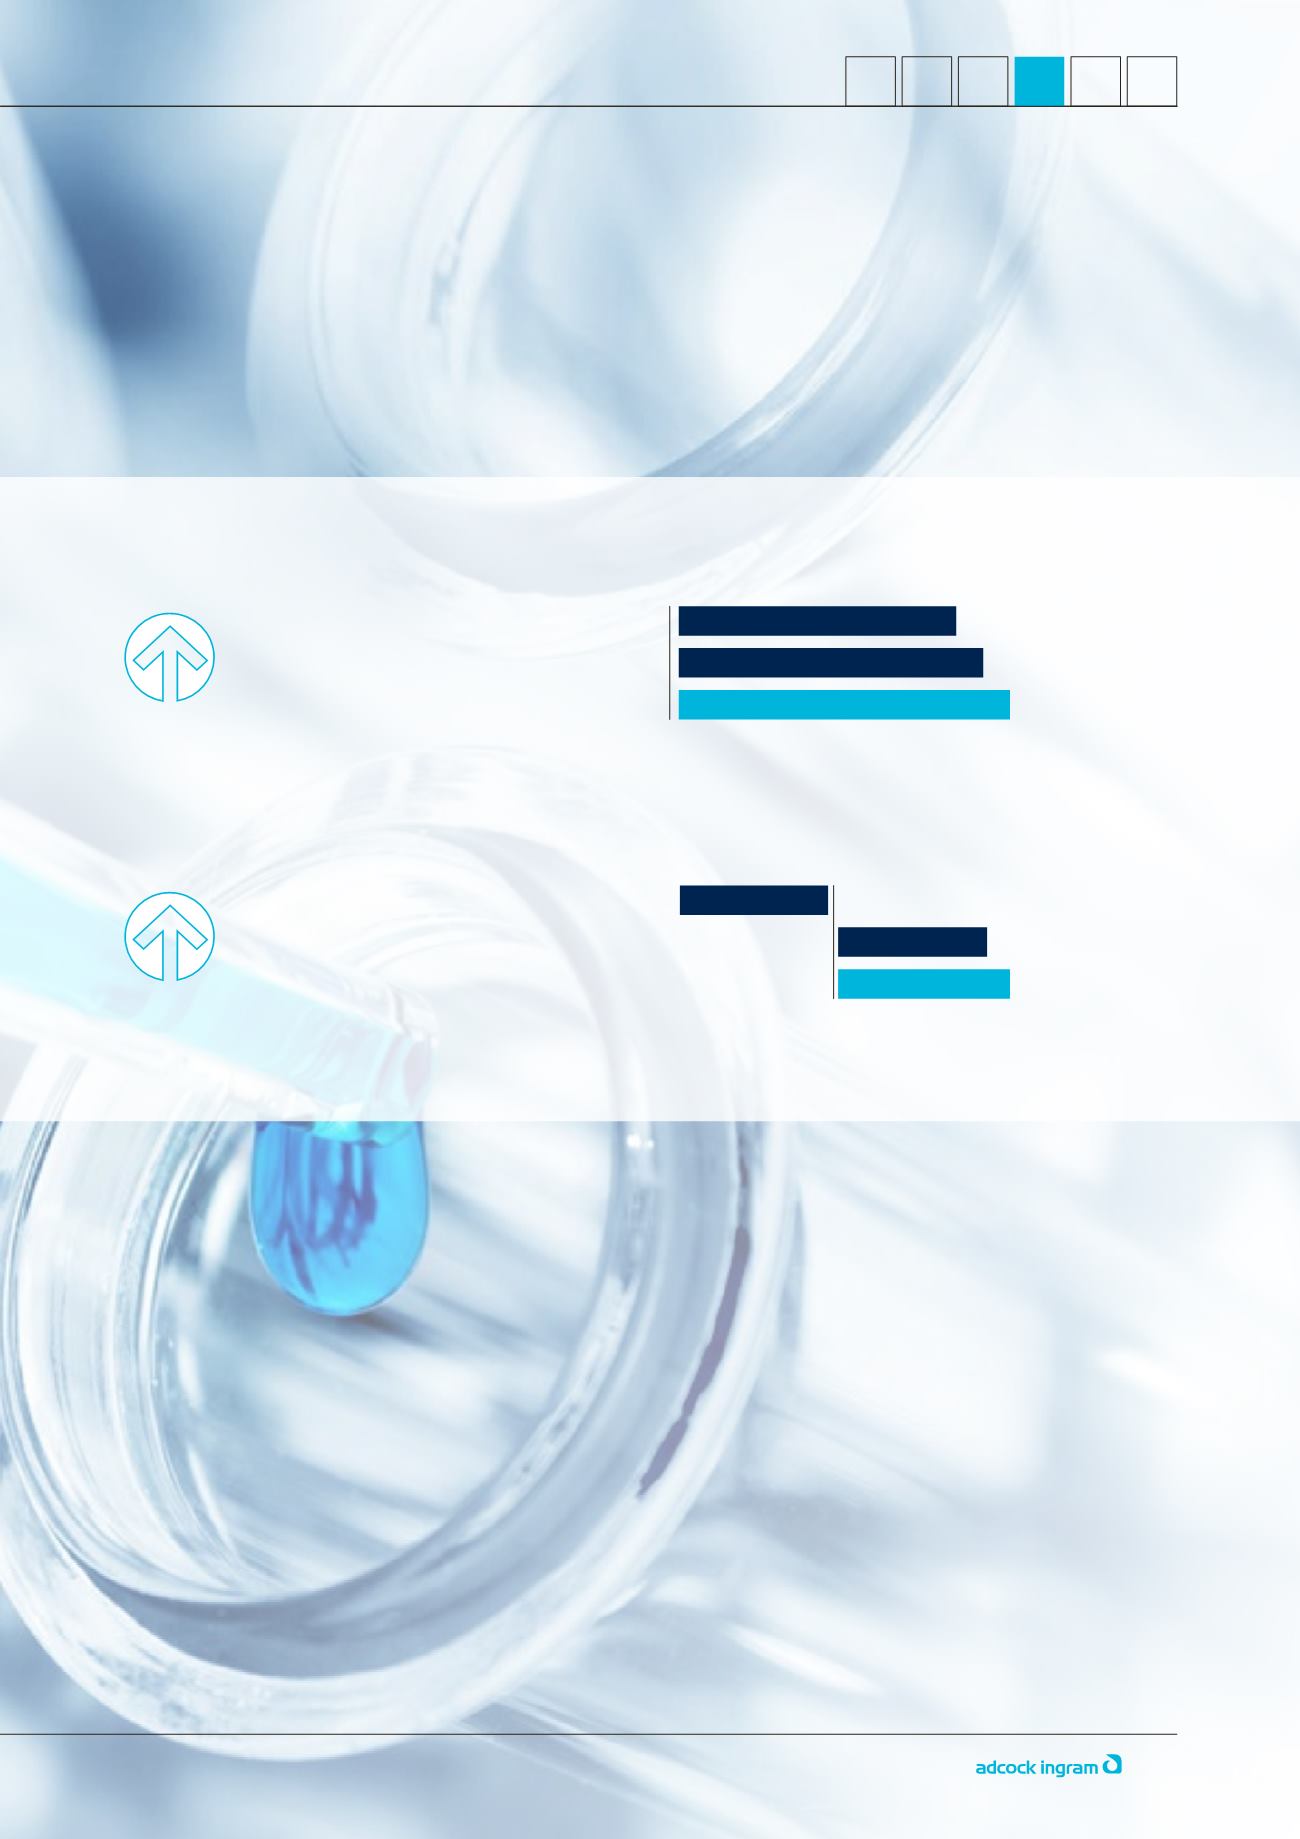
Turnover of R1.2 billion increased by 9% over the prior year with price and volume each contributing 4% and
mix 1%. Medicine delivery as the main driver of the volume improvement was due to strong growth in the Large
Volume Parenterals portfolio including a significant increase in sales of pour bottles. There was also an increase in
focus and activity in the Renal business resulting in solid demand for treatment and therapies across the range,
but with increased pricing pressure.
Gross margin was impacted by the weaker rand and with operating expenses up only R8 million (3%) from last
year, resulted in trading profit of R35 million, and improvement of 7% over 2015.
HOSPITAL
8
,9%
7
,1%
2015
2014
2016
1 126 820
1 027 571
1 226 769
TURNOVER
(R’000)
2015
2014
2016
32 777
(32 808)
35 092
TRADING (LOSS)/PROFIT
(R’000)
Current Assets
Inventory of R1.167 billion is lower than the
June 2015 carrying value of R1.208 billion.
Days in inventory are 119, an improvement
on the 129 days reported in December 2015.
The amount of inventory write offs has
improved in the current year but the focus
on this will continue to further drive down
these impairments.
Trade accounts receivables of R1.320
billion reflect the increased trading activity
and sales pattern. The book remains well-
controlled and 89% of receivables are within
60 days due. There were no material bad
debt write-offs or recoveries in the period.
Government debt accounts for 12% of the
total debtors’book, in line with the prior year.
Borrowings
Long termborrowings of R500million comprise
entirely of the Nedbank term loan, bearing
interest at the 3-month JIBAR rate (currently at
7.3%) + 176 basis points, payable quarterly in
arrears, with the capital due for repayment in
December 2018.
The debt:equity ratio (excluding assets held-
for-sale) at June 2016 is 9.6%, with net debt of
R311 million. The Group is comfortably able to
service its obligations with headroom in the
facilities of more than R1.5 billion.
CASH FLOWS
Cash generated from operations was
R941.1 million (2015: R598.1 million), supported
byadecreaseinworkingcapitalofR113.8million
(June 2015: increase of R126.4million).This
important indicator starts to convey the positive
outcomes of the Group restructure and the
advantages of restored management control.
The cash flow improvement has enabled
the Group to reduce net debt in continuing
operations from R777 million to R311 million at
the end of the financial year.
DIVIDEND
DISTRIBUTION
A final dividend of 54 cents per share was
declared for the year ended 30 June 2016 out of
income reserves. Total dividend distributions for
the year was therefore
104 cents per share an increase of 28%
compared to 2015. This distribution is in
line with the Company’s policy of covering
dividends 2 - 3 times by headline earnings.
FIVE
SIX
THREE
ONE
FOUR
TWO
OUR PERFORMANCE
(continued)
| 33
Integrated Report 2016