



 83 / 182

FIVE
| 79
Integrated Report 2016
ANNUAL FINANCIAL STATEMENTS
(continued)
SIX
THREE
ONE
FOUR
TWO
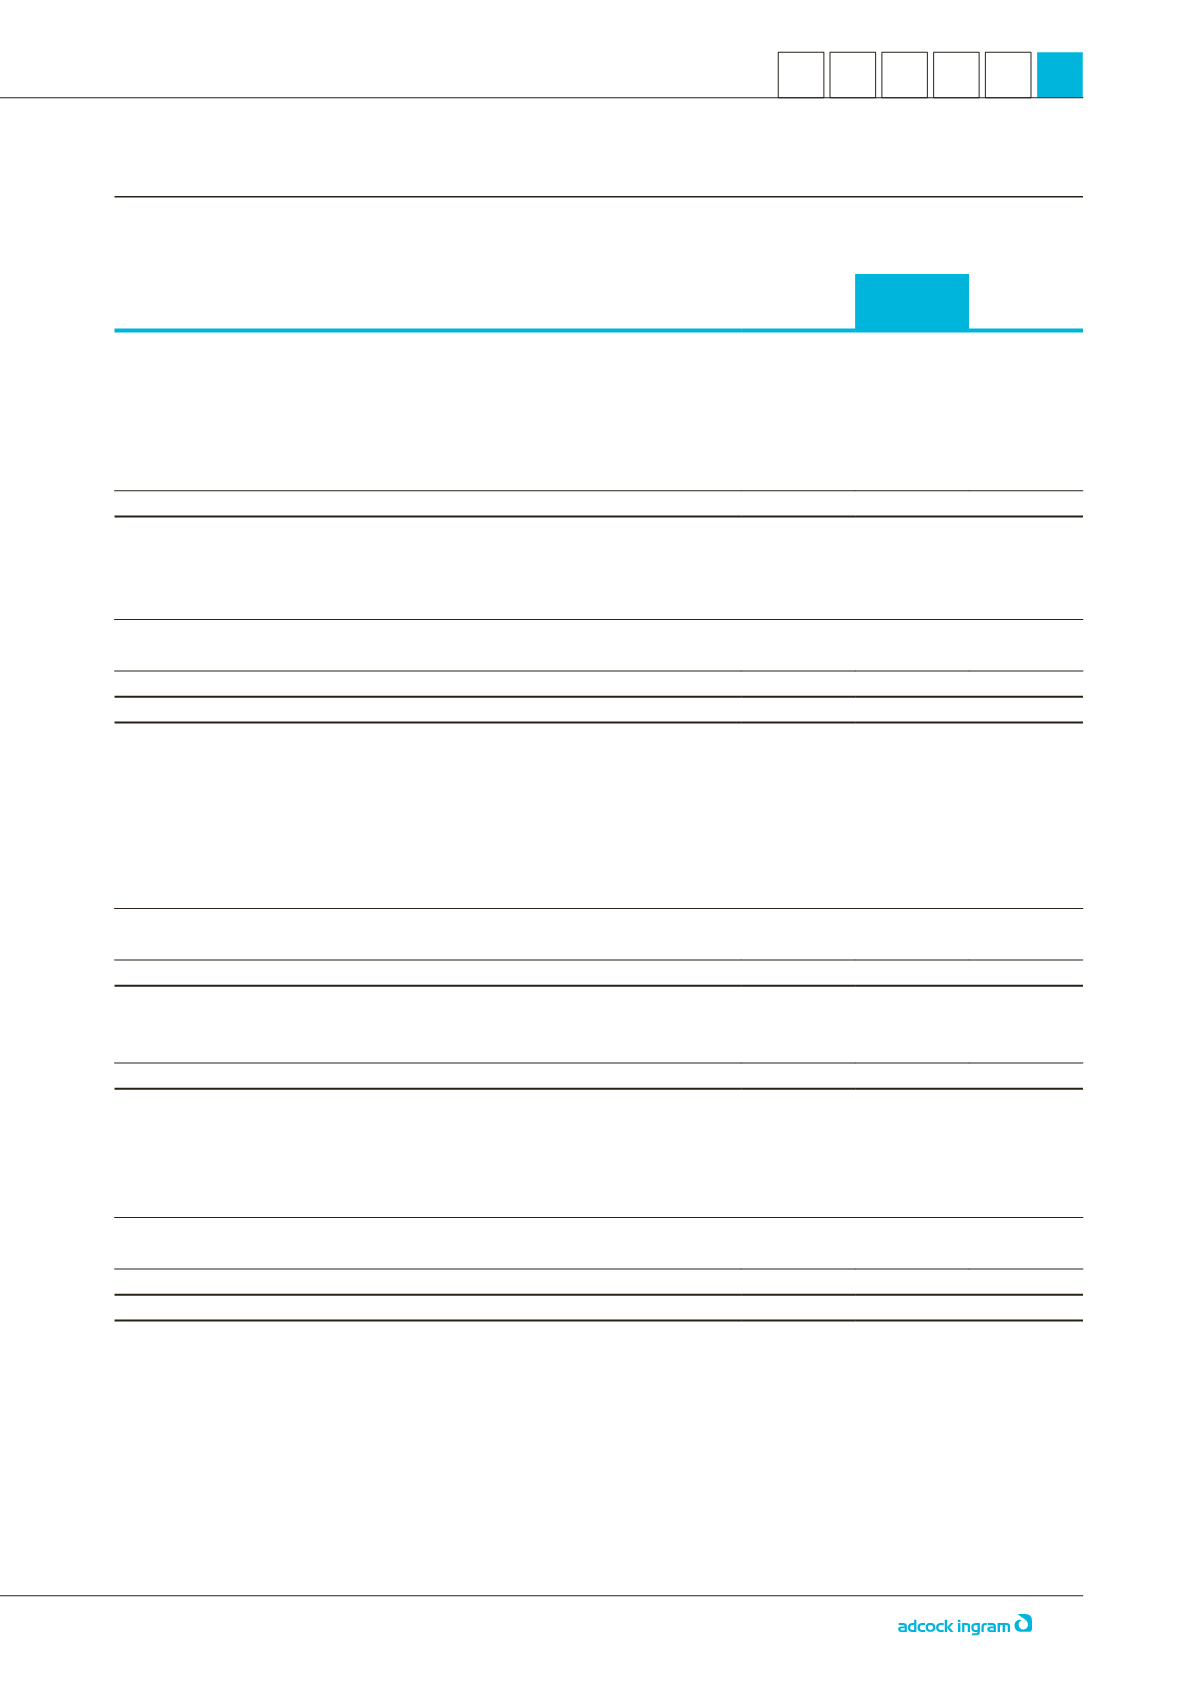
CONSOLIDATED STATEMENTS OF FINANCIAL POSITION
Notes
2016
R’000
2015
R’000
ASSETS
Property, plant and equipment
10
1 423 173
1 490 828
Intangible assets
11
276 070
743 156
Deferred tax
12
8 129
12 091
Other financial assets
13
74 310
91 106
Investment in joint ventures
14
354 139
279 135
Non-current assets
2 135 821
2 616 316
Inventories
15
1 167 005
1 207 581
Trade and other receivables
16
1 398 501
1 408 728
Cash and cash equivalents
17
200 555
147 379
Taxation receivable
26.4
84 087
77 948
Current assets
2 850 148
2 841 636
Assets classified as held-for-sale
2.2
610 638
–
Total current assets
3 460 786
2 841 636
Total assets
5 596 607
5 457 952
EQUITY AND LIABILITIES
Capital and reserves
Issued share capital
18
17 147
16 888
Share premium
19
666 873
512 938
Non-distributable reserves: Continuing operations
20
483 515
505 000
Discontinued operations held-for-sale
20
144 998
–
Retained income
1 916 040
1 982 589
Total shareholders' funds
3 228 573
3 017 415
Non-controlling interests
26 024
99 509
Total equity
3 254 597
3 116 924
Long-term borrowings
21
500 000
513 753
Post-retirement medical liability
22
16 994
22 796
Deferred tax
12
75 868
81 854
Non-current liabilities
592 862
618 403
Trade and other payables
23
1 564 265
1 328 431
Bank overdraft
17
11 755
304 210
Short-term borrowings
21
–
13 273
Cash-settled options
24
3 117
6 519
Provisions
25
69 906
70 192
Current liabilities
1 649 043
1 722 625
Liabilities classified as held-for-sale
2.2
100 105
–
Total current liabilities
1 749 148
1 722 625
Total equity and liabilities
5 596 607
5 457 952